


India at 76 | Looking back through a climate change lens
This week, I am taking a break from the regular news digest. On the occasion of Independence Day, I take a look at how India is doing on the climate change front through 5 charts.

As we approached this Independence Day, and I prepared myself for a flood of articles about the bright future India has before her, I couldn’t help but think about what I believe is going to be one of the biggest challenges we face in the coming decades - climate change. I got thinking about how our actions over the last several decades have got us to where we are today - a country facing a rapidly changing climate that threatens to destroy our homes, our food and life as we know it for a significant share of our 1.4 bn people. In 2019, India was ranked 7th in the Global climate risk index - that ranks countries in terms of the severity of the risk they face due to climate change.

What this article aims to do: Show you 5 charts covering key metrics you will hear often in climate change conversations. With these I hope to bring out how much we have lost in the last few decades and tell you a little bit about how we got here.
What this article is not: It is not in any way a comprehensive ‘State of the climate’ report. There are several important aspects of climate change (e.g. water, conservation) and factors contributing to it (such as biodiversity loss, waste management etc.) that are not touched upon at all. It also does not cover the solutions needed to address this situation.
Let’s get started!
#1: Temperature
India’s surface temperatures are now at least 1 deg C warmer than the 1971-2000 average.

If I had only 1 chart to show, it would be this one.
We can clearly see a warming trend that has only gotten more pronounced in the last 20 years. This is part of a global heating trend and has been directly attributed to human led activities (such as fossil fuel usage, deforestation etc.) that have led to higher green house gas emissions (see chart #3) that are in turn resulting in rising temperatures.
We are already feeling the impact of this in the increasing frequency and intensity of heat waves that we have experienced in the last couple of years.
#2: India’s energy mix
India’s energy mix continues to be dominated by fossil fuels; Oil gas and coal make up 87% of India’s energy mix.

Yes, we have made tremendous progress in renewable energy, especially in the last couple of decades. Our solar energy usage has gone from 20 GwH in 2000 to an 250 TwH in 2022 and wind energy usage has gone from 5 TwH in 2000 to 182 TwH in 2022. However, this chart makes it amply clear that we continue to add energy infrastructure based on fossil fuels (oil, coal and gas) and hence while we are adding solar and wind capacity the current rate of addition is simply not enough. As long as we continue to add fossil fuel based energy capacity, our GHG (Green house gas) emissions will continue to increase.
Our efforts on increasing the use of renewables are indeed commendable. Solar usage has increased by ~75 TwH just in the last year. However, the pace of this transition needs to accelerate massively.
#3: CO2 emissions
India’s per capita CO2 emissions have gone up 12x in the last 70 years

We can see how our per capita CO2 emissions (largest part of GHG) has increased more than 12X in the last 70 years. In absolute terms, our absolute CO2 emissions have gone up 50x since 1947.
Green house gas emissions (of which CO2 is one of the biggest parts) is one of the biggest contributors to the temperature increase that we saw in the first chart.
This was partly inevitable for a developing country as development is linked to increasing energy use. Our per capita energy usage has increased almost 5X in the last 50 years. Example - when a village gets electrified, it directly leads to better health and education outcomes, improves access to opportunities and hence results in a better quality of life for people in the village. However, given our energy mix is predominantly based on fossil fuel (see chart #2), this increase in energy usage has also led to increase in CO2 emissions.
#4: Frequency of extreme weather events
In the last 2 decades, the frequency of all kinds of extreme weather events - floods, cyclones and droughts has gone up
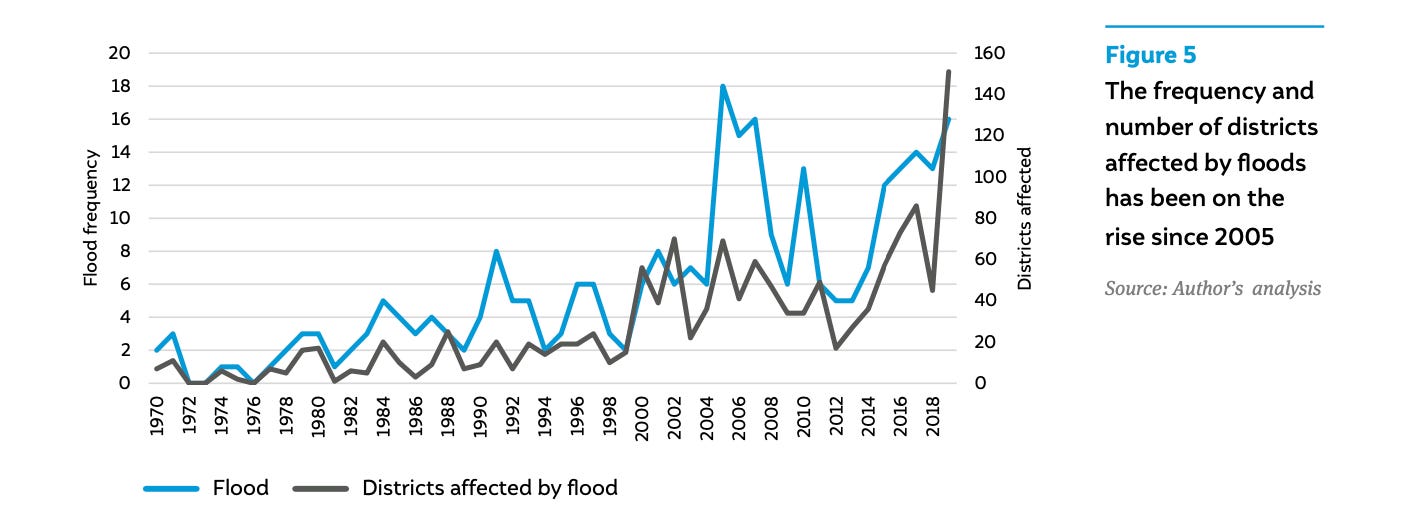


While extreme weather events will happen, the increase in their intensity and frequency has been attributed to climate change. 75% of India’s districts are now at risk of an extreme weather event.
Even with improvements in early warning systems (that warn in advance about an extreme weather event giving time to prepare), this put human life at risk, threatens our food security and has the potential to severely damage essential and expensive infrastructure.
#5: Air pollution
Concentration of particulate matter has increased almost 1.6X in the last 20 years.

As per WHO guidelines, PM (2.5) concentration beyond 5 μg/m3 is dangerous to long term health. Almost all of India’s population lives in areas with particulate matter concentration above this level.
India’s own national air quality standard is 40 μg/m3 and 60% of our population lives in areas that exceeds this level as well.
PM (2.5) concentration has been linked to respiratory and cardio-vascular diseases and this level of air pollution can reduce life expectancy by almost 5 years.
To conclude, our climate and environment is not in great shape. Temperatures are rising, air quality is deteriorating and extreme weather events are becoming more frequent and intense. We have started making strides in the right direction in terms of energy transition to renewable sources but the pace of that transition needs to accelerate significantly if we want to reduce our GHG emissions and meet our net zero goals.
Hope you liked this piece and it helped give you a glance into India is doing on the environment front. Please subscribe if you’d like more of these articles delivered to your inbox.
Sources/ References:
Show your stripes (https://showyourstripes.info/c/globe)
CEEW: Preparing India for extreme climate events (Report)
Well written.. need to work on our environment nation wise n individualally