
Why this summer is so hot | An explainer
There's been much talk of how this summer is unusually hot and may even end up being the hottest ever! Here’s an explainer on what is happening and what got us here.

The IMD has predicted that we will see ‘above normal’ temperatures this summer. We are still in early April and several parts of India have already seen heat waves with temperatures crossing 40 deg C, causing concerns about what the next couple of months will bring as the summer intensifies. And this is especially worrying as India braces for general elections that will see massive rallies and polling in this sweltering heat.

But is it really getting hot?

If you are one of those who would rather trust data than your own gut (or in this case skin literally feeling the heat) or believe this Uncle on Twitter saying ‘its not getting hotter, we just need to toughen up’,

here are some wild statistics for you.

Source: IMD data set
This chart shows annual mean temperatures in India from 1901. While temperatures vary from year to year, you can clearly see that it was mostly in the 24.5 to 25.7 range right up till the 1980s, after which something began to change. Post the 80’s we can see a clearly upward trending graph. 2016 was the hottest year ever with mean avg. temperature recorded at 26.2 deg C, a full 0.7 deg C above the 1900-2000 average and a full 0.15 deg C higher than the previous record of 26.05 in 2009!

Source: IMD data set
Similar trend, even more exaggerated, can be seen when you look at annual maximum temperatures. You can see maximum temperatures beginning to trend upwards from the 1960s and the increase becoming sharper post 2000s.
So there is no doubt, that it is getting hotter and it is getting hotter faster.
Why is it getting so hot?
We’ll talk about why this summer (2024) is so hot and even more so in our cities.
There are 3 factors at play - climate change at a global level, the heat island effect at a local level and the El Nino effect making it worse this year.
1. Climate change and global warming
Climate change is causing temperatures everywhere to increase. Over the last few decades the entire earth has warmed up. And more recently, it feels like ‘the earth has a fever’. 2023 was globally the warmest year on record and it not just surpassed but shattered temperature records every month across the world!

This is majorly attributed to the Greenhouse effect - the increasing concentration of Carbon-di-oxide (CO2) causes temperatures to increase. The simplest way to explain the Greenhouse effect is that CO2 forms a blanket around the earth. The more the concentration of CO2 in the atmosphere, the thicker the blanket and warmer the earth.
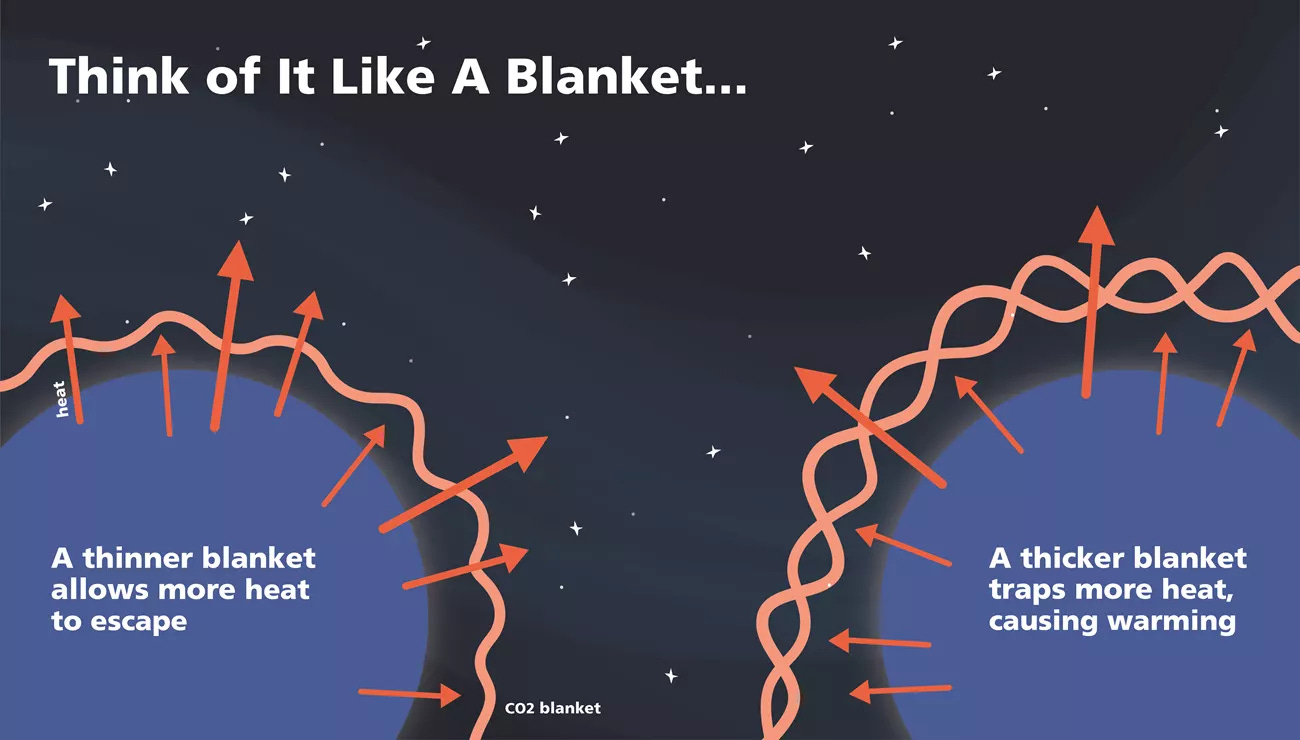
Source: Key facts on climate change (NPS)
Is the CO2 concentration really increasing that much?
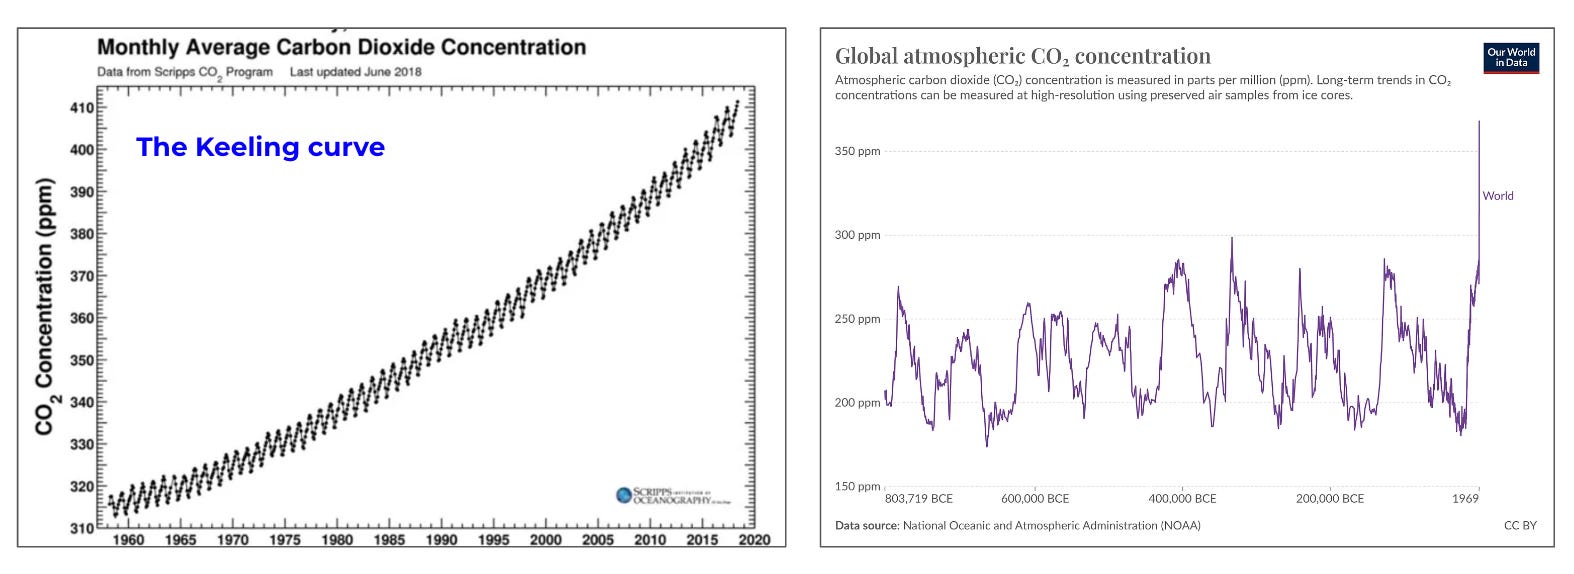
The chart on the left is the Keeling curve. It is a graph that represents the concentration of carbon dioxide (CO2) in Earth’s atmosphere since 1958. You can clearly see that the concentration of CO2 is going up each year! The Keeling Curve is named after its creator, Dr. Charles David Keeling, who discovered global atmospheric CO2 levels were rising nearly every year.
The chart on the right will help you put this increase in perspective - it shows CO2 concentrations in the earths atmosphere over the last 800,000 years. We are currently seeing CO2 concentrations never seen before in the ~100,000 years of history that humans have inhabited the earth. Before the industrial revolution the highest levels seen were ~280 ppm. As of 2024, we are at 425 ppm of CO2.
Is CO2 the only culprit?
No, there are other gases too which have a similar warming effect - Methane, Nitrous oxide and HFCs are all considered greenhouse gases. And most of these cause much more warming per unit of the gas compared to CO2. However, CO2 is the most abundant by far and definitely the main villian.
So why is the concentration of CO2 increasing?

Okay I am not blaming Taylor Swift. The song ‘It’s me, I’m the problem it’s me’ is just what all of us humans need to be saying when it comes to ‘Who has caused the increase in CO2’. There are many factors that contribute to CO2 emissions, and almost all of them are due to human activities. Most of these emissions come from the use of fossil fuels (petrol, diesel, natural gas, coal) - when fossil fuels are burnt to release energy, they release CO2 as a by product.
Sector contributing to CO2 emissions include transportation (road, shipping, aviation), electricity production, agriculture, industry (e.g. cement and steel production) and residential uses for cooking and heating. The use of fossil fuels across these sectors has seen a staggering spike since the industrial revolution and that is the primary cause of the increase in CO2 emissions.
To summarise, increase in fossil fuel usage over the last 5-6 decades has resulted in a significant increase the atmospheric CO2 concentration, that has in turn caused a steady increase in global temperatures.
2. The Urban Heat Island effect
While the whole earth is getting warmer some places are getting hotter than others. The ‘Urban Heat Island’ or UHI is a term used to describe a city or metropolitan area that is much warmer than the rural areas surrounding it.
Studies have shown that cities can be as much as 3-10 deg C warmer than their surrounding rural areas.

Source: Cool roof rating council
Why does this happen?
Higher heat retention by manmade surfaces - Urban surfaces are made of materials like concrete, asphalt, bricks, steel and glass that are good at retaining heat and tend to hold more heat compared to grass, trees and open ground.
Lack of water bodies and trees - Rural areas tend to have more open water bodies. The water in these evaporates and cools the surface while doing so. Similarly, trees see the phenomenon of transpiration where water vapour escapes from the pores in their leaves. This also results in cooling the air around trees. That is why one instantly feels cooler on entering a shaded area.
Human activity in urban areas generates more heat - Urban areas see higher concentration of people and hence more activities that contribute to emissions. Some of these are vicious cycles. For instance, ACs work by cooling the air inside the room and throwing hot air outside. This in turn makes the streets outside hotter, increasing the overall temperature of the area and increasing the need for air conditioning inside.
High building density - A lot of buildings packed very densely prevents air circulation and reduces the speed of wind which could otherwise have cooled the air. This also created a challenge at night, when the absorbed heat is trying to escape. It gets trapped in between tall buildings and as a result the temperatures don’t fall down as much even at night.
The Urban heat island effect is at play in all our cities - Mumbai, Gurgaon, Bangalore etc. In most of our metros, population has exploded in the past few decades accompanied by unplanned development. We have built dense building complexes at the cost of green spaces and water bodies. Naturally, our cities are getting even hotter. Even within a city, there are micro-climates. Areas which have trees and water bodies, less dense buildings and better wind circulation are cooler. For example, one can clearly feel a drop of a couple of degrees in temperature on entering Cubbon park in Bangalore.
3. El Nino
El Niño and La Niña are climate patterns in the Pacific Ocean that can affect weather worldwide - where El Niño is the warm phase and La Niña is the cool phase. Episodes of El Niño and La Niña typically last nine to 12 months, but can sometimes last for years. El Niño and La Niña events occur every two to seven years, on average
In India, El Niño years are associated with high temperatures, weak monsoon winds and dry weather.

As you can see in the chart above, El Nino years typically see higher temperatures compared to La Nina years. At present, the world is experiencing an El Nino event, which started around July 2023 and is still continuing. The El Nino effect is expected to weaken by June, giving India a normal monsoon. However, as it continues through the summer it is likely to bring higher that usual temperatures. 2016 which was the hottest year on record for India was an El Nino year. And it is likely that the current El Nino episode may make the 2024 the hottest summer ever.
El Nino is a weather event that has existed for centuries and it not caused due to climate change. It is one of the factors contributing to variations in climate between years even before we began to see global warming. So even if global warming due to the increase in carbon emissions wasn’t happening, 2023 and 2024 would be hotter compared to 2022 and 2021 (that saw La Nina)
In summary
To summarise, global warming due to the greenhouse effect is causing the entire world to warm up. This is made more intense in cities due to the urban heat island effect. Both of these affect long term temperature trends - they are responsible for making this decade on average hotter than all earlier decades. The El Nino episode at play this year is making this particular year hotter than others. El Nino would have made 2023 and 2024 hotter than 2021 and 2022 (La Nina years) even without global warming. But on its own it would not have made 2023 the hottest year in the last 150 years. That has been made possible only because of climate change.
Hope this post gave you a better understanding of the factors that are contributing to the exceptionally hot summer this year. If you found this helpful, please subscribe and share it with someone who may benefit from this. Do leave a comment if you liked the article!
Hi Sailee - thank you for consolidating this information, would it be ok to share it with folks with whom we are talking to?
I do my bit by posting it on my WhatsApp status. I reach a few people that way. I feel bad scaring them at times about what's going to happen. But unless people start talking about, nothing will change. So yes, every bit counts. Good to see that you are doing this.